Our Research Topics
- non-invasive clinical diagnostic tools
- sensor system development for precision agriculture
- novel microelectromechanical (MEMS) devices
- nanotechnology manufacturing methods
- biodefense applications
- new materials for MEMS/NEMS applications
- mechanical and bioinstrumentation design
- bioinformatics and machine learning approaches for data analysis
Bioinformatics and Machine Learning Approaches for Data Analysis
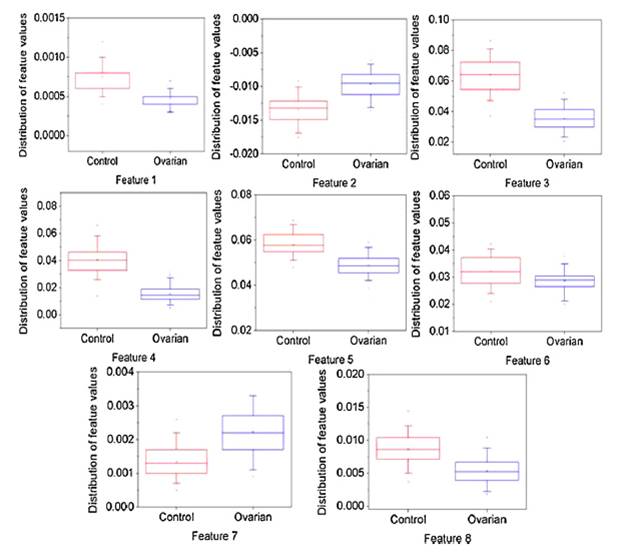
Chemical sensors routinely produce multi-dimensional data sets that are complicated to interpret. We use sophisticated algorithms to understand the outputs of our devices and instrumentation. In one of our recent studies, we used a techique termed "swarm intelligence" to develop algorithms that could quickly zero in on signal locations in sensor outputs that are important. For example, we used this method (in conjunction with other signal processing methods) to determine the locations of cancer biomarkers in SELDI-TOF spectra. [from our paper: Zhao W, Davis CE*. Swarm intelligence based wavelet coefficient feature selection for mass spectral classification: an application to proteomics data. (2009) Analytica Chimica Acta 651(1): 15-23.]
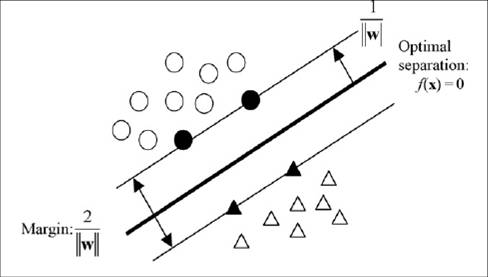
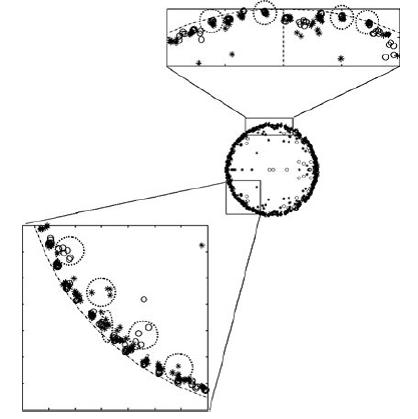
Another example of a new type of classification scheme that we are exploring, is the support vector machine. A schematic illustration of the SVM construction is shown below. Basically the SVMis a classification method based on maximizing the margin between two classes. Black symbols are support vectors. [from our paper: Zhao W, Sankaran S, Ibanez AM, Dandekar AM, Davis CE*. (2009) Two-dimensional wavelet analysis based classification of gas chromatogram differential mobility spectrometry signals. Analytica Chimica Acta 647: 46-53.]
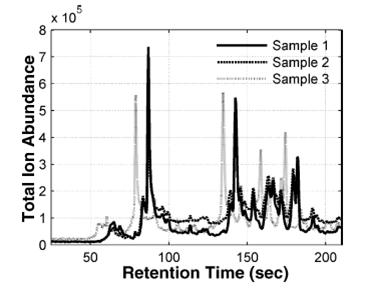
In some other cases, our chemical sensors can output data that is highly reproducible, but has slight temporal shifts making data analysis difficult. Below we show an example of data that has such a time shift. [from our paper: Krebs MD, Tingley RD, Kang J, Zeskind JE, Holmboe ME, Davis CE*. (2006) Alignment of analytical sensor data by landmark selection from complex chemical mixtures. Chemometrics and Intelligent Laboratory Systems 81(1): 74-81.]
There are several ways we can deal with artifacts (like time shifts) in our sensor data. One method is to use autoregressive modeling to decompose the signal space into it's major frequency components. We see that some of those components begin to exhibit clustering effects that allow us to classify the underlying data. [from our paper: KKrebs MD, Tingley RD, Zeskind JE, Kang JM, Holmboe ME, Davis CE*. (2004) Autoregressive modeling of analytical sensor data can yield classifiers in the predictor coefficient parameter space. Bioinformatics 21(8): 1325-31.]
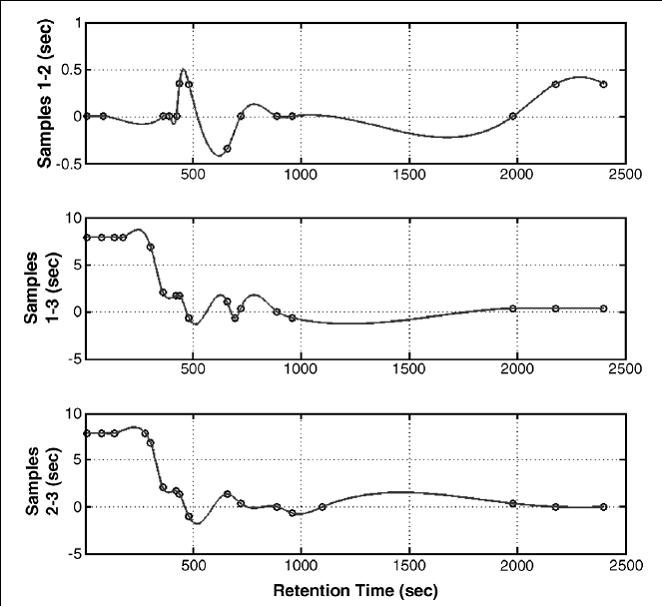
We can come up with dynamic methods to adjust for temporal disturbances in the data. These corrections are sometimes complex, and our functional apporximations to correct the data can differ from sample to sample. [from our paper: Krebs MD, Tingley RD, Kang J, Zeskind JE, Holmboe ME, Davis CE*. (2006) Alignment of analytical sensor data by landmark selection from complex chemical mixtures. Chemometrics and Intelligent Laboratory Systems 81(1): 74-81.]
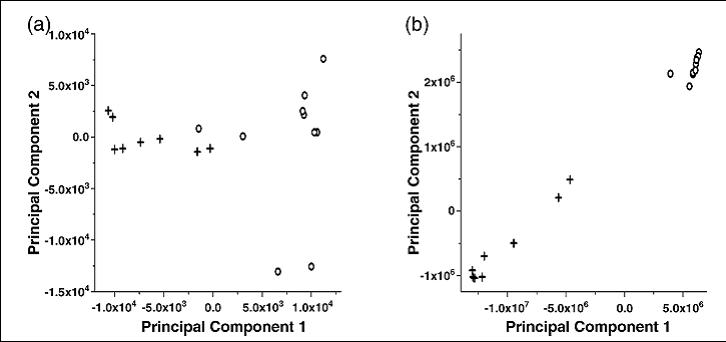
Once data sets are adjusted for disturbances though, it can greatly increase classification effects (shown below). [from our paper: Krebs MD, Tingley RD, Kang J, Zeskind JE, Holmboe ME, Davis CE*. (2006) Alignment of analytical sensor data by landmark selection from complex chemical mixtures. Chemometrics and Intelligent Laboratory Systems 81(1): 74-81.]
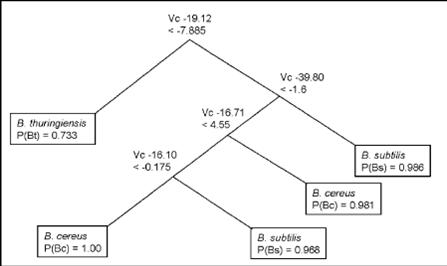
Another very effective algorithm to classify chemical sensor data is the decision tree process (shown below). [from our paper: Krebs MD, Mansfield B, Yip P, Cohen SJ, Sonenshein AL, Hitt B, Davis CE*. (2006) Spore biomarkers differentiate between closely-related Bacillus species using differential mobility spectrometry. Biomolecular Engineering 23(2): 119-127.]
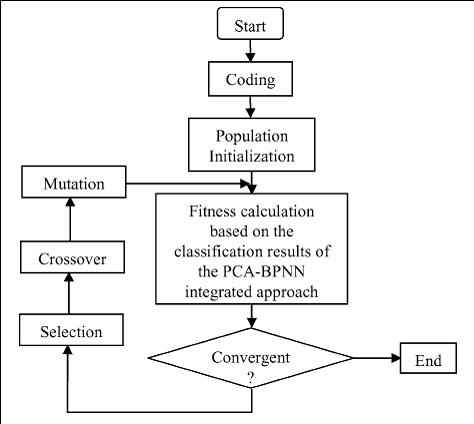
The genetic algorithm (GA) is also a very popular method to classify complex sensor data sets. [from our paper: Ayer S, Zhao W, Davis CE*. (2008) Differentiation of proteins and viruses using pyrolysis gas chromatography differential mobility spectrometry (PY/GC/DMS) and pattern recognition. IEEE Sensors Journal 8(9): 1586-1592.]